What is AI observability? A guide for engineers


AI observability is defined as the practice of collecting, correlating, and interpreting multi-layer telemetry across an AI system to measure both infrastructure performance and the cognitive behaviour of AI models in production. Unlike traditional monitoring, which tracks deterministic system states, AI observability must account for non-deterministic outputs, probabilistic reasoning, and the compound complexity of multi-agent architectures. Platforms such as Dynatrace, Braintrust, and IBM have each built distinct approaches to this problem, reflecting how seriously the enterprise sector now treats AI system visibility. The four foundational pillars are logs, metrics, traces, and evaluations. Together, they form the instrumentation layer that separates teams who understand what their AI is doing from those who are, effectively, flying blind.
What is AI observability and why does it matter?
AI observability is the ability to monitor, analyse, and continuously improve AI systems through integrated telemetry that captures both infrastructure health and the cognitive behaviour of AI models. The term extends the classical observability concept (derived from control theory) into territory that traditional application performance monitoring was never designed to cover. Where a conventional system either works or does not, an AI system can produce outputs that are technically successful but factually wrong, contextually harmful, or silently degrading in quality over time.
This distinction matters enormously for engineering teams. A model that returns a 200 HTTP status code while hallucinating financial data is invisible to standard monitoring. AI observability closes that gap by treating output quality as a first-class signal alongside latency and error rates.

The stakes are high. Without structured telemetry, production AI agent deployments suffer from indefinite mean time to detect and resolve incidents. That translates directly into operational risk, reputational exposure, and compounding technical debt that becomes harder to unwind the longer it goes unaddressed.
What are the core pillars of AI observability?
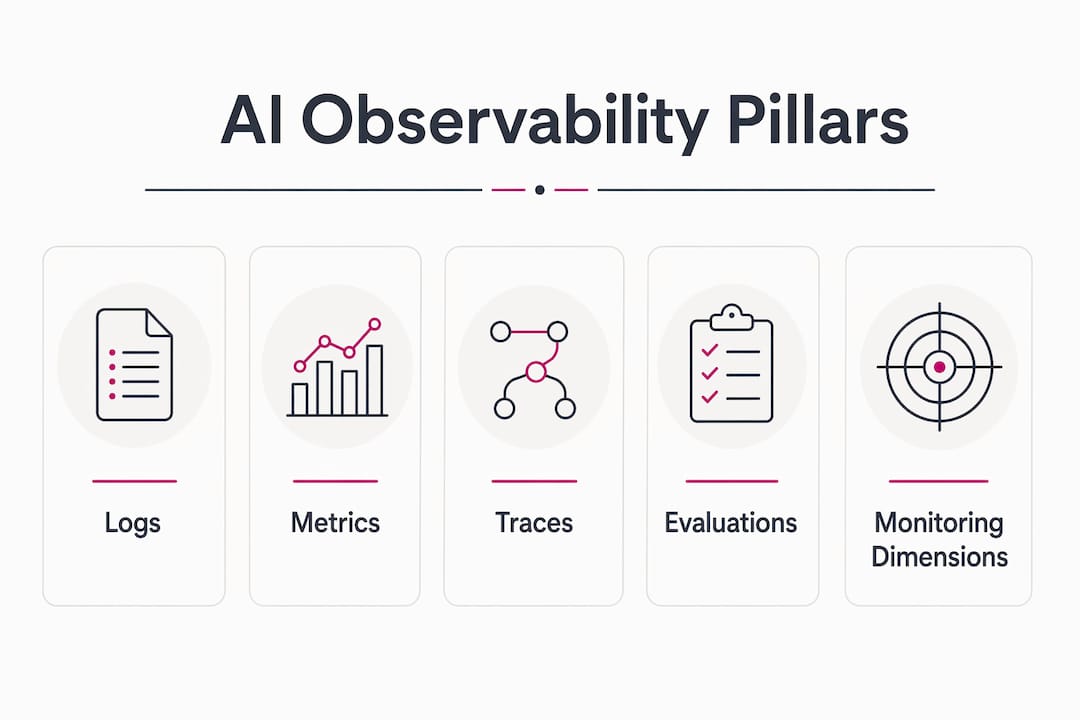
AI observability tracks five core dimensions that conventional APM tools fail to capture: input monitoring, output quality (including hallucination frequency and toxicity), retrieval mechanisms, agent workflow, and drift detection. These sit on top of the four foundational telemetry pillars. Understanding both layers is necessary before you instrument anything.
The four telemetry pillars:
- Logs capture event-level records of what happened, including prompts sent, responses received, tool calls made, and errors encountered. Unlike traditional append-only logs, AI observability logs must support annotation and re-scoring after the fact.
- Metrics quantify system behaviour over time: token consumption per request, latency distributions, error rates, and cost per inference. These feed cost governance and capacity planning.
- Traces document the full execution path of a request through the AI stack, from user input through retrieval, model reasoning, and tool execution. Traces in AI systems serve as the primary documentation of decision logic, revealing quality degradations that are otherwise mistaken for infrastructure issues.
- Evaluations are the pillar unique to AI. They apply automated judges, human reviewers, or domain expert scoring to assess whether outputs are accurate, safe, and aligned with intent.
The five monitoring dimensions:
- Input monitoring detects prompt injection attempts, unusual input patterns, and data quality issues before they reach the model.
- Output quality tracks hallucination rates, toxicity scores, and factual accuracy against ground truth.
- Retrieval monitors vector database performance, chunk relevance, and retrieval accuracy in RAG (retrieval-augmented generation) architectures.
- Agent workflow traces tool selection, execution order, and inter-agent communication in multi-agent systems.
- Drift detection identifies when model behaviour shifts over time due to data distribution changes or model updates.
Pro Tip: Instrument your retrieval layer from day one. Retrieval failures are the most common source of silent quality decay in RAG systems, yet they are the last thing teams think to monitor.
How does AI observability differ from traditional monitoring?
The fundamental difference is determinism. Traditional systems produce the same output for the same input, every time. AI systems do not. This single property invalidates most assumptions that conventional observability tools are built on.
| Dimension | Traditional observability | AI observability |
|---|---|---|
| Output nature | Deterministic, binary pass/fail | Probabilistic, quality-graded |
| Primary signals | CPU, memory, latency, error rate | Token usage, hallucination rate, drift, tool misuse |
| Log architecture | Append-only, immutable | Mutable, annotatable, re-scorable |
| Failure mode | System crash or timeout | Silent quality decay, incorrect reasoning |
| Tooling examples | Datadog, Prometheus, Grafana | Braintrust, Arize, Dynatrace AI |
| Debugging model | Reactive incident response | Continuous evaluation and iteration |
AI observability data requires annotation and re-scoring after creation, unlike append-only traditional logs. This necessitates a fundamentally different data architecture, one that supports automated judges, delayed human review, and domain expert input across extended timelines. Most engineering teams underestimate this requirement until they are already in production.
Multi-agent orchestration raises the complexity further. When five agents collaborate to complete a task, a failure in agent three may only surface as a degraded output from agent five. Detailed distributed tracing combined with semantic evaluations enables teams to pinpoint inefficient or incorrect agent reasoning across that entire chain. Without it, debugging becomes guesswork.
Successful AI observability treats debugging as an ongoing engineering cycle requiring instrumentation of all system layers. The phrase “debugging in the dark” is not rhetorical. Teams without end-to-end tracing genuinely cannot distinguish between a retrieval failure, a model reasoning error, and a tool execution bug when they produce similar-looking outputs.
What practical benefits does AI observability bring to enterprises?
The business case for AI observability resolves into four categories: cost governance, security and compliance, performance quality, and operational reliability.
-
Cost governance. Token consumption is the primary cost driver in generative AI deployments. The primary ROI for AI observability in enterprise is bridging the disconnect between executive AI budgeting and operational realities by measuring token consumption and vector database usage in near real-time. Without this visibility, engineering teams cannot explain cost overruns to finance, and finance cannot set meaningful budgets.
-
Security and compliance. Many organisations treat AI observability as an afterthought, creating security blind spots that allow prompt injection attacks to go undetected until external disclosure occurs. Traditional logs cannot capture the input context necessary to identify these attacks. Structured telemetry with input monitoring closes this gap and provides the audit trail that regulators increasingly expect.
-
Performance quality. Silent quality decay is the most insidious failure mode in production AI. A model that was accurate at launch may degrade over weeks as data distributions shift, without triggering any infrastructure alert. Drift detection within an AI observability framework catches this before it reaches users or clients.
-
Operational reliability. AI observability systems generate structured telemetry that automated agents consume in real-time to adjust system behaviour autonomously. This shifts the architecture from reactive human debugging to proactive, self-correcting systems. For enterprises running AI in customer-facing or revenue-critical workflows, this shift is the difference between acceptable and unacceptable reliability.
The compounding benefit is speed of improvement. When tracing and evaluation are integrated, every production run generates data that feeds the next iteration. Separating those two functions, as many teams do when they adopt point solutions, drastically slows model performance improvement velocity.
How is AI observability implemented effectively?
Effective implementation requires treating observability as an architectural decision, not a tooling afterthought. The following principles apply regardless of which platform you select.
Adopt OpenTelemetry GenAI semantic conventions from the start. The OpenTelemetry project has published semantic conventions specifically for generative AI workloads, covering span attributes for model calls, token counts, and tool invocations. Early deployment of AI observability infrastructure with standardised semantic conventions is key to scaling AI agent initiatives confidently and securely. Teams that instrument with proprietary schemas early find migration costly later.
Build a closed-loop data workflow. Tracing alone is insufficient. The workflow must connect tracing to evaluation to iteration. Breaking the closed observability loop by separating tracing and evaluation tools drastically slows model performance improvement velocity. Platforms such as Braintrust are designed around this closed loop. Arize and Groundcover offer complementary capabilities for teams with more complex multi-model environments.
Instrument every layer of the agentic stack:
- LLM call inputs and outputs, including full prompt context
- Retrieval steps: query sent, documents retrieved, relevance scores
- Tool calls: name, arguments, return values, and latency
- Agent-to-agent communication in orchestrated workflows
- Final output quality scores from automated evaluators
Handle multi-agent complexity with end-to-end correlation. Each agent in a pipeline must emit traces that share a common root span identifier. Without this, correlating a degraded final output back to a specific agent decision is practically impossible at scale.
Pro Tip: Start with evaluation before you optimise for latency. Teams that instrument quality metrics first discover that many latency optimisations they were planning would have degraded output accuracy. Quality is the constraint; latency is the variable.
Key takeaways
AI observability requires four telemetry pillars (logs, metrics, traces, and evaluations) plus five monitoring dimensions to provide genuine visibility into AI system behaviour and output quality.
| Point | Details |
|---|---|
| Four telemetry pillars | Logs, metrics, traces, and evaluations form the non-negotiable foundation of any AI observability implementation. |
| Five monitoring dimensions | Input, output quality, retrieval, agent workflow, and drift detection cover the AI-specific failure modes that standard APM misses. |
| Mutable data architecture | AI logs must support annotation and re-scoring; append-only architectures cannot support the evaluation workflows AI requires. |
| Closed-loop improvement | Integrating tracing and evaluation in a single workflow accelerates model quality improvement; separating them creates velocity drag. |
| Security and cost governance | Structured telemetry provides the audit trail for prompt injection detection and the token-level data finance teams need for budget accountability. |
Why AI observability is the control plane your agentic stack needs
I have operated AI agents in production across finance, legal, and GTM workflows, and the pattern I see repeatedly is this: teams instrument their infrastructure meticulously and their AI layer not at all. They know exactly how much CPU their vector database is consuming. They have no idea whether their retrieval is returning relevant chunks, whether their model is hallucinating on edge cases, or whether agent three in their pipeline is silently misrouting tasks.
The shift I find most significant is not technical. It is conceptual. Observability for AI is not a debugging tool you reach for when something breaks. It is the control plane through which you govern trust, safety, and accountability in systems that make consequential decisions autonomously. Once you frame it that way, the investment calculus changes entirely.
The organisations I see struggling most with AI observability are not the ones with immature tooling. They are the ones with mature infrastructure teams who have not yet accepted that their existing mental models do not transfer. A senior SRE who has spent a decade with Prometheus and Grafana will instinctively reach for those tools when an AI agent misbehaves. They will find them useless for diagnosing a hallucination or a retrieval failure, and that experience is disorienting.
My practical recommendation: instrument for evaluation before you instrument for performance. Know whether your system is producing correct outputs before you optimise how fast it produces them. The teams that invert this order spend months optimising a system that was never producing reliable outputs to begin with.
The future trajectory is towards observability as an autonomous control plane, where telemetry feeds policy engines that adjust agent behaviour in real-time without human intervention. That architecture is already emerging in platforms like Kore.ai and Dynatrace. The teams building that capability now will have a structural advantage over those who treat observability as a reporting function.
, Hayat
Working with an AI agent operator who instruments from day one

Meethayat builds and operates AI agents for SMEs across finance, legal, and GTM functions, with observability instrumented into every deployment from the outset. That means token-level cost tracking, retrieval quality monitoring, and closed-loop evaluation workflows are in place before any agent goes near a production workflow. If you are evaluating whether to build this capability in-house or engage a specialist, the operator vs consultant decision is worth understanding clearly before you commit budget. For teams ready to deploy, the AI agent operator service covers the full agentic stack, including the observability layer that most deployments get wrong.
FAQ
What is AI observability in simple terms?
AI observability is the practice of collecting and interpreting telemetry from AI systems to understand what they are doing, why they are producing specific outputs, and whether those outputs are correct. It extends beyond traditional monitoring by treating output quality as a measurable signal alongside latency and error rates.
How does AI observability differ from standard application monitoring?
Standard monitoring tracks deterministic system states; AI observability tracks probabilistic outputs, hallucination rates, retrieval accuracy, and agent reasoning chains. The data architecture is also different: AI observability requires mutable, annotatable records rather than append-only logs.
What tools are used for AI observability?
Platforms including Braintrust, Arize, Dynatrace, and Groundcover are purpose-built for AI observability. They support distributed tracing, automated evaluation, and the closed-loop workflows that connect production telemetry to model improvement cycles.
Why do organisations neglect AI observability?
Many organisations treat AI observability as an afterthought, typically because infrastructure teams apply existing APM mental models to AI systems and find them adequate until a silent quality failure or security incident forces a reassessment. The cost of that delay compounds quickly in production environments.
What is the most important pillar of AI observability?
Evaluations are the pillar unique to AI and the one most frequently absent in early deployments. Without automated or human scoring of output quality, teams have infrastructure visibility but no cognitive visibility into whether their AI is actually performing its intended function correctly.